Global Ripple Effects: Port Congestion and Tariff Volatility in China and the United States
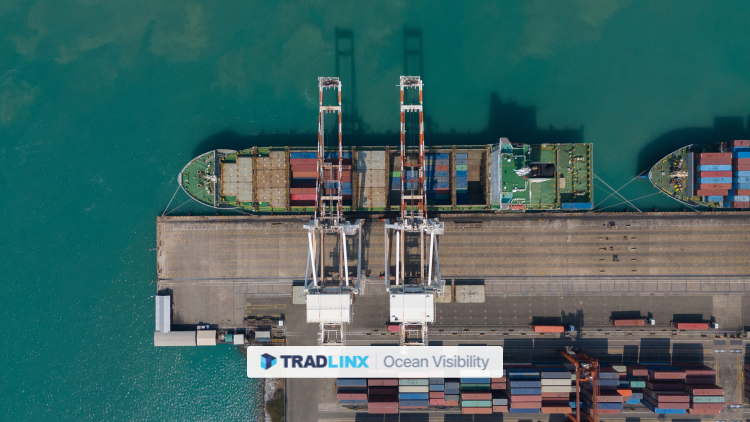
As of late May 2025, key ports in China (Shenzhen) and the United States (Los Angeles, New York) are experiencing serious backlogs—with dozens of container ships waiting at anchor, transit times stretched, and logistics managers facing unpredictable delays.
In Shenzhen, reports indicated up to 50 ships waiting offshore, mirroring the COVID-era gridlocks of 2021. Meanwhile, Los Angeles recorded 42 anchored vessels, and New York 14. Terminal operators are struggling with container dwell times, chassis shortages, and erratic rail handoffs, despite new queuing systems like LA’s Safety and Air Quality Area (SAQA).
These disruptions are not isolated. They’re symptoms of a broader surge in demand, policy uncertainty, and infrastructural bottlenecks—setting the stage for a volatile shipping summer.
📦 Tariff Pause Triggers Transpacific Booking Explosion (+275%)
On May 12, 2025, the U.S. and China agreed to a 90-day pause on reciprocal tariffs, reducing duty rates from 145% to 30%. The move created a sudden and massive surge in container volumes across the Pacific. Shippers rushed to beat the July 9 reinstatement deadline—turning what’s usually a gradual seasonal ramp-up into an aggressive front-loading wave.
- Transpacific Bookings Up 275%: Freight forwarders reported a 275% week-over-week spike in bookings from China to the U.S. in mid-May 2025.
- Spot Rates Surge: The Shanghai–Los Angeles rate jumped 16% in one week to $3,136 per 40ft, while Shanghai–New York climbed 19% to $4,350.
- Carriers React: Maersk, Hapag-Lloyd and others announced GRIs of $1,000–$3,000 per container for June bookings, and began deploying larger vessels to absorb volume.
This sudden surge has created a de facto early peak season, testing infrastructure and capacity limits across both sides of the ocean.
📦 Inventory Overstocking and Surcharges
The tariff-driven urgency has forced shippers into defensive inventory strategies. According to Drewry, importers are now carrying 15–20% more inventory than pre-pause levels to safeguard against post–July 9 disruptions. This precautionary stockpiling is causing ripple effects in warehousing, trucking, and last-mile delivery systems.
- Warehouse Strain: Distribution centers in Chicago, Dallas, and Memphis report capacity saturation. Temporary overflow storage rates have increased by 25–35% in high-demand zones.
- Surcharges Mount: MSC, CMA CGM, and others have added $500–$1,200 per TEU congestion surcharges on Asia–Europe and transpacific routes.
- Trucking Premiums: In New York/New Jersey, premium rates of 25–40% are now common for guaranteed container pickup slots, due to chassis mismatches and labor gaps.
Shippers are navigating a difficult tradeoff: pay high to move now or risk higher duties and even worse delays post-deadline.
🔁 Interconnected Challenges: From Berths to Barges
The surge in container traffic is magnifying existing structural bottlenecks—not just at ports, but also across rivers, railways, and terminals. The problem is no longer volume—it’s systemic throughput limitations.
- Waterway Constraints: Rhine River barge loads are down to 50–80% capacity due to drought, and Yangtze barge flows to Chongqing and Wuhan have slowed by 40%, pushing more loads onto rail and road.
- Labor Shortfalls: A national strike in Belgium (May 20) halted Antwerp’s Kallo Lock for 36 hours, while Shenzhen port turnaround times rose 12–18 hours due to dockworker holidays.
- Equipment Gaps: Chassis availability in the U.S. has fallen to 82% of demand, causing extended container dwell times—now averaging 4.3 days at Los Angeles terminals.
From Asia to Europe to the U.S., these compounding frictions are making “just-in-time” shipping feel increasingly like a relic of the past.
🚢 Strategic Responses: Carrier and Shipper Tactics
To mitigate the crunch and capture short-term revenue, both carriers and shippers are deploying a mix of tactical and strategic countermeasures. The result? Market fluidity, but also greater unpredictability.
Carrier Adaptations
- Vessel Diversions: The Gemini Alliance has redirected 22% of its Asia–Europe fleet via the Suez Canal after a partial U.S.–Houthi ceasefire, opening capacity for transpacific coverage.
- Blank Sailings: Approximately 8% of East–West sailings were canceled in May to concentrate on high-yield routes such as Shanghai–LA, sidelining less profitable lanes.
Shipper Countermoves
- Nearshoring Surge: Chinese firms have increased investment in northern Mexico by 17% month-over-month, seeking to bypass tariff uncertainty through regional proximity to U.S. buyers.
- Airfreight Substitution: High-value goods are shifting to air. Shenzhen–Anchorage rates rose 22% in May as electronics firms moved urgent volumes off the water.
For both carriers and shippers, agility is becoming more critical than capacity as trade conditions shift by the week.

📉 Projected Outcomes and Supply Chain Risks
As the July 9 tariff deadline nears, the market is bracing for knock-on effects far beyond short-term volume spikes. Several systemic risks could ripple well into Q3 and Q4 2025.
- Longer Delays Forecasted: Drewry predicts 30–40% longer average vessel wait times at Shenzhen and Los Angeles in June, as capacity continues to lag demand.
- Inflationary Pressure: Analysts estimate the tariff pause has already added 1.2–1.8% to U.S. consumer inflation, with further rises likely if rate hikes persist into peak season.
- Resilience Gaps: The World Bank’s 2025 Global Logistics Resilience Index finds that over 60% of Fortune 500 firms lack contingency plans for multi-regional port disruption.
Unless long-term trade frameworks are agreed, many companies will remain stuck in reactive logistics cycles driven by political calendars—not operational logic.
🧭 Impact of Upcoming Tariff Deadlines on Transpacific Trade
With just weeks before the July 9 tariff deadline, shippers are navigating one of the most volatile transpacific peak seasons in recent memory. The data paints a clear arc: a surge, a cliff, and long-term uncertainty.
| Phase | Trade Volume Impact | Operational Effects | Rate Trends |
|---|---|---|---|
| Pre-deadline (now–mid-July) | 📦 Surge (+50% bookings) | Port congestion, warehouse strain | 📈 Rates rising sharply |
| Post-deadline (after July 9) | 📉 Likely volume cliff | Idle capacity, blank sailings | 📉 Rates likely to fall |
| Ongoing uncertainty | 🔄 Volatile, hard to forecast | Inventory bloat, poor planning | ⚠️ Rate instability |
In short: the tariff-driven surge is not just a flashpoint for rates—it’s exposing deep fragility in global logistics systems and reinforcing the need for real-time visibility, strategic capacity planning, and diversified sourcing strategies.
📊 Key Stats Summary: China–U.S. Freight Surge (May–July 2025)
| 📌 Metric | 📊 Value / Trend |
|---|---|
| China–U.S. bookings (week-over-week) | ⬆️ 275% surge |
| Spot rate (Shanghai–LA) | $3,136/FEU (⬆️ 16%) |
| Spot rate (Shanghai–NY) | $4,350/FEU (⬆️ 19%) |
| Inventory buildup before tariff deadline | ⬆️ 15–20% over normal |
| Ships waiting offshore – Shenzhen | 🚢 Up to 50 vessels |
| Ships waiting offshore – Los Angeles | 🚢 42 vessels |
| Chassis availability (US ports) | ⚠️ 82% of demand |
| Warehouse pricing in major hubs | ⬆️ 25–35% for urgent slots |
| Airfreight rates (Shenzhen–Anchorage) | ✈️ Up 22% in May |
| Post-deadline volume risk | 📉 Likely sharp drop after July 9 |
| Tariff pause window | ⏳ May 12 – July 9, 2025 |
| Estimated impact on U.S. inflation | 🧮 +1.2–1.8% |
🔗 Sources & References
- Superior Shipping – California Ship Backlogs
- Int’l Bond & Marine – NY/NJ Port Bottlenecks
- Drewry – Cancelled Sailings Tracker (May 2025)
- Gava Group – U.S. Freight Market Trends
- Kuehne+Nagel – Port Updates
- CNBC – U.S.–China Tariff Pause Report
- ASEAN Lines – Spot Rate Reaction
- Yahoo Finance – Export Surge Insights

Why overpay for visibility? TRADLINX saves you 40% with transparent per–Master B/L pricing. Get 99% accuracy, 12 updates daily, and 80% ETA accuracy improvements, trusted by 83,000+ logistics teams and global leaders like Samsung and LG Chem.


Prefer email? Contact us directly at min.so@tradlinx.com (Americas) or henry.jo@tradlinx.com (EMEA/Asia)


Leave a Reply