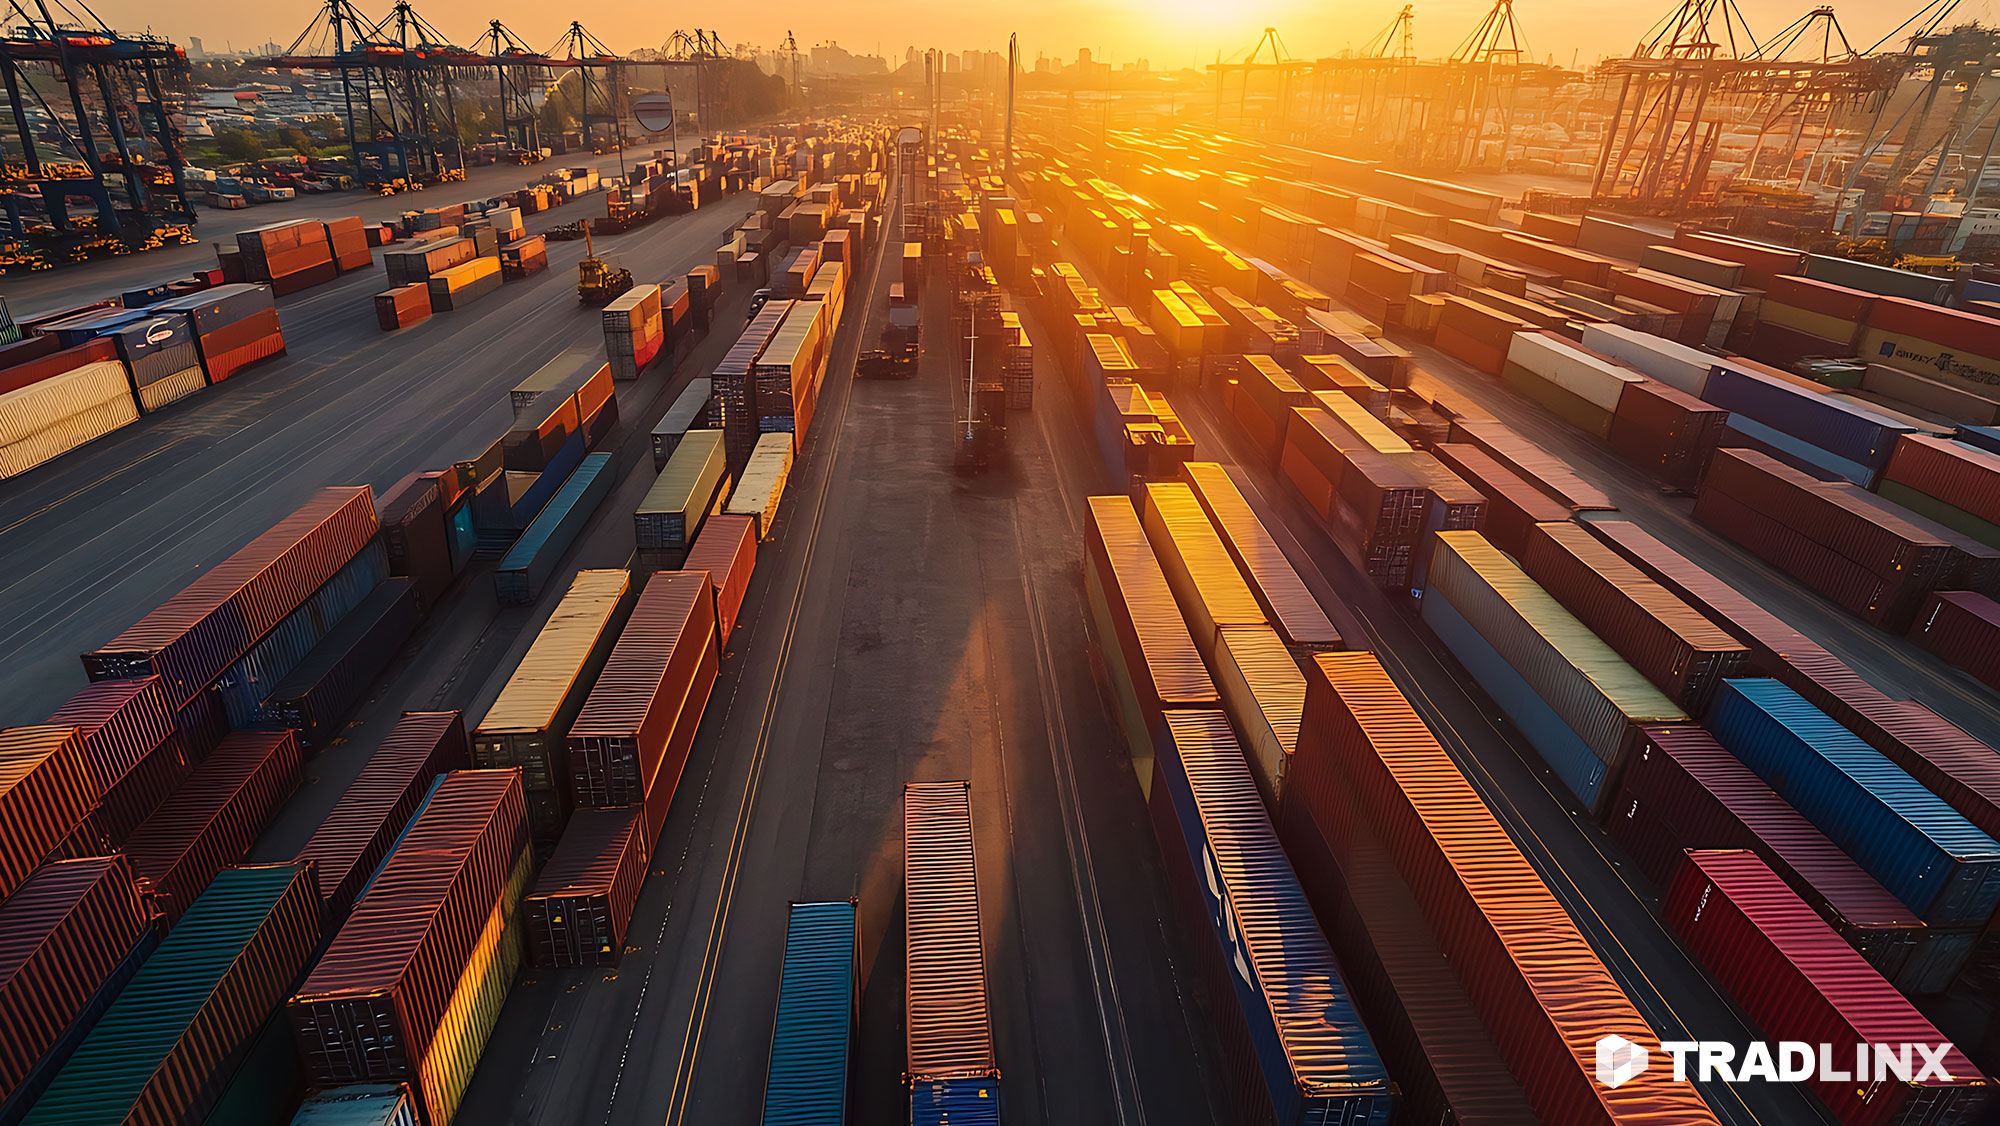
Global averages say port congestion is almost back to normal. Yet containers through Antwerp, Rotterdam, Hamburg or Valencia still feel slow and unpredictable. This post separates peak crisis from the current plateau and explains what the data actually says about European ports, why some carriers have been willing to skip flagship hubs, and what shippers and LSPs should do for 2026 planning.
TL;DR
- Global port congestion has improved sharply since 2021. In June 2025, one benchmark put global average congestion at about 0.36 days, only a few quarters from pre pandemic levels.1
- Europe is the laggard. Through Q3 and Q4 2025, key hubs such as Antwerp, Rotterdam, Hamburg and Valencia still show vessel waits and dwell times that are clearly above 2019 baselines.2,3,4,5
- During the June 2025 peak, some North Europe ports saw vessel delays of 6 to 10 days and barge waits of 2 to 3 days, with effects that have not fully washed out of inland networks.2,3,6
- Congestion has been serious enough that Maersk removed Rotterdam from its TA5 transatlantic rotation from late June 2025, citing operational constraints at Northern Europe terminals.7,8
- For 2026, shippers and LSPs should assume Europe stays structurally slower than global averages, monitor a small set of port specific metrics, and build buffers and routing options rather than waiting for a full reset.
1. The headline: global averages look fine, your lanes do not
In June 2025, several analyses of global port performance concluded that congestion had improved more than 70 percent compared with mid 2023 and that average congestion worldwide was around 0.36 days. On that basis, the industry narrative became that port congestion was only a few quarters away from pre pandemic levels.1
From a distance, that story is correct. Compared with the 2021 peak, many regions have normalised. North America in particular looks much healthier than during the worst of the pandemic bottlenecks.
However, averages hide regional laggards. At the same time as global headlines were celebrating improvement, North Europe and parts of the Mediterranean were still dealing with:
- Multi day vessel queues at Antwerp and Rotterdam in October 2025.
- Repeated strikes and protests that shut or slowed key terminals at Rotterdam, Hamburg and Antwerp.2,3,4,9,10
- Barge waits measured in dozens of hours, which extended dwell times even when berths were available.3,6
For shippers who depend on these hubs, the question is not whether global averages are improving. The practical question is how bad Europe really is now, compared with a healthy baseline, and how much of the mid 2025 crisis is still stored in inland networks.
2. How bad is it compared with a healthy baseline
There is no single universal measure of congestion, but three simple yardsticks help: vessel wait time, container dwell time and schedule reliability on your services.
Vessel wait times: from hours to days
Before 2020, many large container ports aimed for vessel waits of under a day, with 0.5 to 1.5 days considered normal and 2 to 3 days already a concern.11,12 Against that context:
- Rotterdam – In mid October 2025, one major forwarder reported a seven day average vessel wait of around 2.6 days, with yard utilisation still elevated and residual delays likely even after strikes ended.5
- Antwerp – At the end of October, Antwerp’s seven day average vessel wait was around 2.5 days, with yard congestion near 90 percent and congestion driven by storms and labour shortages as well as structural pressure.2
- Hamburg – In Everstream’s mid November 2025 risk report, Hamburg showed an average wait of about 1.2 days, still above a comfortable baseline and with reduced gate access after protests blocked port roads.4
- Valencia – In the same November snapshot, Valencia had some of the highest waits in Europe, around 3.2 days, putting it near the upper end of the regional range.4
These numbers are not as extreme as the worst pandemic peaks, but they are still clearly above pre 2020 norms. For many importers, the difference between 0.5 and 2.5 days is the difference between a manageable buffer and late deliveries that cascade into trucking and warehousing operations.
Container dwell and inland delays: where the pain really sits
Vessel wait times are only part of the story. For European hubs, dwell time and inland delays are often more important than the initial queue.
- During the June 2025 crisis, North Europe hubs including Rotterdam and Antwerp saw vessel delays of 6 to 10 days at peak and barge waits of roughly 66 to 77 hours, pushing total dwell for some flows from a healthy 1 to 3 days to a week or more.2,3,6
- Inland, low Rhine water levels and rail bottlenecks extended the time it took for containers to leave ports, meaning congestion at the terminal was only the start of the delay chain.2,6,9
By late Q3 and early Q4, dwell and barge delays had improved from the June extremes, but both remained meaningfully above 2019 baselines. For many importers, that feels “as bad as ever” because the inland effects show up as missed delivery windows, not just port statistics.
Schedule reliability: global recovery, European drag
Schedule reliability has recovered from 2021 lows but remains below pre pandemic levels. Sea Intelligence and other analysts have reported global on time arrival rates rising back above 60 percent in 2025, after falling below 40 percent during the worst congestion period.13,14 However:
- Asia to North Europe and transatlantic services touching Northern European hubs are still materially less reliable than pre 2020.
- Short transit times between North Europe ports leave very little room to recover from a delay in Rotterdam or Antwerp before the vessel reaches Hamburg or another hub, so disruptions compound across the rotation.2,3,15
For shippers, the practical takeaway is that European ports are no longer at the absolute peak of congestion, but they are still operating slower than their own history and slower than some competing regions.
3. When congestion is bad enough for carriers to skip Rotterdam
Carriers constantly adjust rotations and schedules. Capacity shifts, alliances change and seasonal demand fluctuates. However, it is rare for a global carrier to drop one of the world’s largest container ports from a flagship service purely because it cannot maintain reliability through that hub.
In May and June 2025, Maersk publicly announced that its TA5 transatlantic service would stop calling Rotterdam from 25 June 2025 onward. The company cited operational constraints in Northern Europe and said that vessels would sail directly from Felixstowe in the United Kingdom to Hamburg instead.7,8,16
Commentary around the change emphasised two points:
- The decision was explicitly tied to continuing capacity problems and congestion at Rotterdam.
- It followed earlier efforts to work around the backlog, suggesting that the port had become a structural risk for that specific service rather than a short term inconvenience.7,8,16
Other carriers have made smaller adjustments, trimming or reordering North Europe calls and shifting some volumes toward alternative gateways, including Mediterranean ports for certain Asia Europe flows.3,15
These changes do not mean that carriers are abandoning Rotterdam or Antwerp. They do illustrate that congestion has reached a level where skipping or downgrading even top tier hubs can be the rational choice for maintaining schedule integrity on selected services.
4. Why congestion is persisting instead of fading away
Given how long 2021 and 2022 felt in operational terms, many logistics leaders hoped that by late 2025 congestion would simply recede as a topic. The fact that Europe remains a problem region has several structural reasons.
Repeated labour actions and protest cycles
- In October 2025, a strike by lashers at Rotterdam nearly doubled the number of ships in the queue, from a typical six or seven vessels to around 13, as loading and unloading slowed or stopped.17,18
- At the same time, a series of actions by harbour pilots at Antwerp Bruges reduced the number of ships handled per day to roughly half the normal level and left nearly 190 vessels waiting to berth or depart in mid October.19
- National and regional strikes in Belgium and surrounding countries have forced terminals and inland hubs into stop start patterns that extend well beyond the days of the action itself.9,10
Each event on its own is manageable. In combination, they keep ports from returning to a steady state that would allow them to burn off accumulated delay.
Inland transport and barge bottlenecks
- Barge waits of multiple days at Rotterdam and Antwerp in mid 2025 meant that import containers could not leave the ports quickly, even when berth productivity improved.2,3,6,13
- Low water levels on the Rhine and congestion on key rail corridors reduced the effective capacity of inland networks, which is one of the main reasons dwell time remains elevated relative to 2019.2,6,9
From a shipper’s point of view, this is one of the most important lessons. A port can announce that vessel waits have improved, while reality at the gateway still feels slow because inland flows are blocked.
Alliance and service reshuffles
Alliance changes and the formation of new groupings, including the Gemini Cooperation, have forced carriers to renegotiate terminal windows and reconfigure rotations. While this can improve efficiency in the medium term, it creates friction in the short term as ports and carriers experiment with new patterns.3,15
When those experiments take place in an environment that is already strained by strikes and inland bottlenecks, the result is a slower path back to stability.
5. What 2026 might look like for European ports
No one can predict exact dwell times or vessel queues for a specific week in 2026. It is possible to sketch scenarios that help with planning.
Scenario 1: gradual convergence toward global averages
Under this scenario:
- Labour disputes are resolved or move into more predictable patterns.
- Alliance changes settle, and ports optimise windows and yard operations around new schedules.
- Water levels and inland capacity improve enough that barge and rail flows become more stable.
If that happens, North Europe performance is likely to drift closer to the improving global average. Vessel waits could move back toward one day or less at major hubs, and dwell could return to the low single day range for standard flows.
Scenario 2: Europe remains the laggard region
In the second scenario, some of the mid 2025 stressors continue:
- Red Sea routing and geopolitical risk keep schedules tight and increase calls at North Europe hubs.
- Labour pressure remains high, with recurring pilot or terminal actions in Belgium, the Netherlands and Germany.
- Inland constraints are only partially resolved, so Rhine and rail bottlenecks resurface in peak season.
In this case, global averages may look almost normal in 2026, yet North Europe remains a region where importers plan around persistent extra days of dwell and volatile queues.
From a risk management perspective, shippers and LSPs should plan as if Europe will follow the second scenario. If conditions improve faster, buffers can be relaxed. If they do not, you will not be caught by surprise.
6. What LSPs and shippers should actually do
European port congestion is no longer a surprise event. It is a structural feature of the current market. That means the most useful question is not “will congestion end” but “how should we operate as long as it is here”.
1) Watch port specific metrics, not just global averages
- Track vessel waits and yard utilisation for the specific ports you rely on, such as Antwerp, Rotterdam, Hamburg, Bremerhaven and Valencia.2,3,4,5,10
- Monitor barge and rail delays on your main inland corridors. For many European flows, this is where the real risk sits.
- Pair schedule reliability statistics with your own delivery performance to see where you consistently miss internal or customer targets.
2) Build and test routing options
- Where feasible, test alternative gateways such as Hamburg or certain Mediterranean ports for part of your volume, especially for high value or time sensitive cargo.
- Review truck, barge and rail capacities for those alternatives, so you are not swapping one bottleneck for another.
3) Adjust customer promises and buffers
- Translate the extra days of dwell and wait into realistic lead times for customers that use European hubs.
- Use lane specific buffers instead of a single global safety factor. Antwerp and Rotterdam may need larger buffers than other regions in 2026.
4) Upgrade visibility on Europe specific flows
- Ensure that your visibility tools cover the full journey across European hubs, including transhipments and inland moves, not just port to port legs.
- Set exceptions that focus on Europe related risks, such as extended dwell beyond an agreed threshold or missed rail connections from key terminals.
7. How TRADLINX helps you live with Europe’s congestion, not just read about it
Congestion at Antwerp or Rotterdam is not something any single shipper or forwarder can fix. What you can control is how quickly you see it, how accurately you measure it on your lanes and how fast you respond when a delay becomes serious.
TRADLINX Ocean Visibility is designed to support that kind of operational decision making.
- Port and lane specific timelines. TRADLINX consolidates carrier, terminal and vessel data into a single shipment timeline, so you can see how long containers actually sit at each European hub instead of inferring from scattered status messages.
- Event level monitoring for European gateways. Milestones such as gate in, loaded, discharged, available and out gated are tracked consistently across carriers, which makes it easier to compare performance for Antwerp, Rotterdam, Hamburg and alternative ports.
- Exception alerts tuned to congestion risk. You can set rules that highlight extended dwell, missed transhipments or repeated delays on specific services, so operational teams can intervene before delays become stock outs or production stops.
- Shareable visibility. Tracking links and reports make it easier to explain Europe specific congestion to internal stakeholders and customers using the same underlying data, rather than a chain of emails.
European ports may remain slower than the global average in 2026. With the right visibility and lane specific planning, they do not have to remain a black box.

Sources and further reading
- Global port congestion only a few quarters away from pre pandemic levels – summary of global congestion trends and 0.36 day average.
- Kuehne + Nagel port operational updates, 30 October 2025 – Antwerp vessel waits and congestion.
- Port operational updates, 10–16 October 2025 – Rotterdam vessel waits and yard utilisation.
- Everstream, Port Congestion Report 18 November 2025 – Hamburg and Valencia wait times and protest impact.
- TRADLINX, Worldwide port delays surge 300 percent in June 2025 – June peak congestion and European hub examples.
- Logward, Tackling port congestion with flexible orchestration in 2025 – discussion of multi day vessel waits and barge delays in North Europe.
- Trans.info, Maersk drops Rotterdam amid port congestion – analysis of TA5 skipping Rotterdam due to capacity issues.
- Maersk, TA5 service update – official notice of Rotterdam removal from TA5 rotation.
- The Loadstar, Port congestion now a significant challenge to global supply chains – overview of extended waits at several European ports in late 2025.
- Metro, Belgium’s national strike and European port network congestion – inland and gateway impacts.
- Reuters, Rotterdam port container traffic disrupted as lashers strike – details of October 2025 action.
- Reuters, Oil deliveries disrupted by Antwerp port congestion after pilots strike – vessel backlog figures and capacity impact.
- TRADLINX, European Port Crisis 2025 – detailed breakdown of Rotterdam, Antwerp, Hamburg and Bremerhaven disruptions.
Prefer email? Contact us directly at min.so@tradlinx.com (Americas), sondre.lyndon@tradlinx.com (Europe) or henry.jo@tradlinx.com (EMEA/Asia)


Leave a Reply