
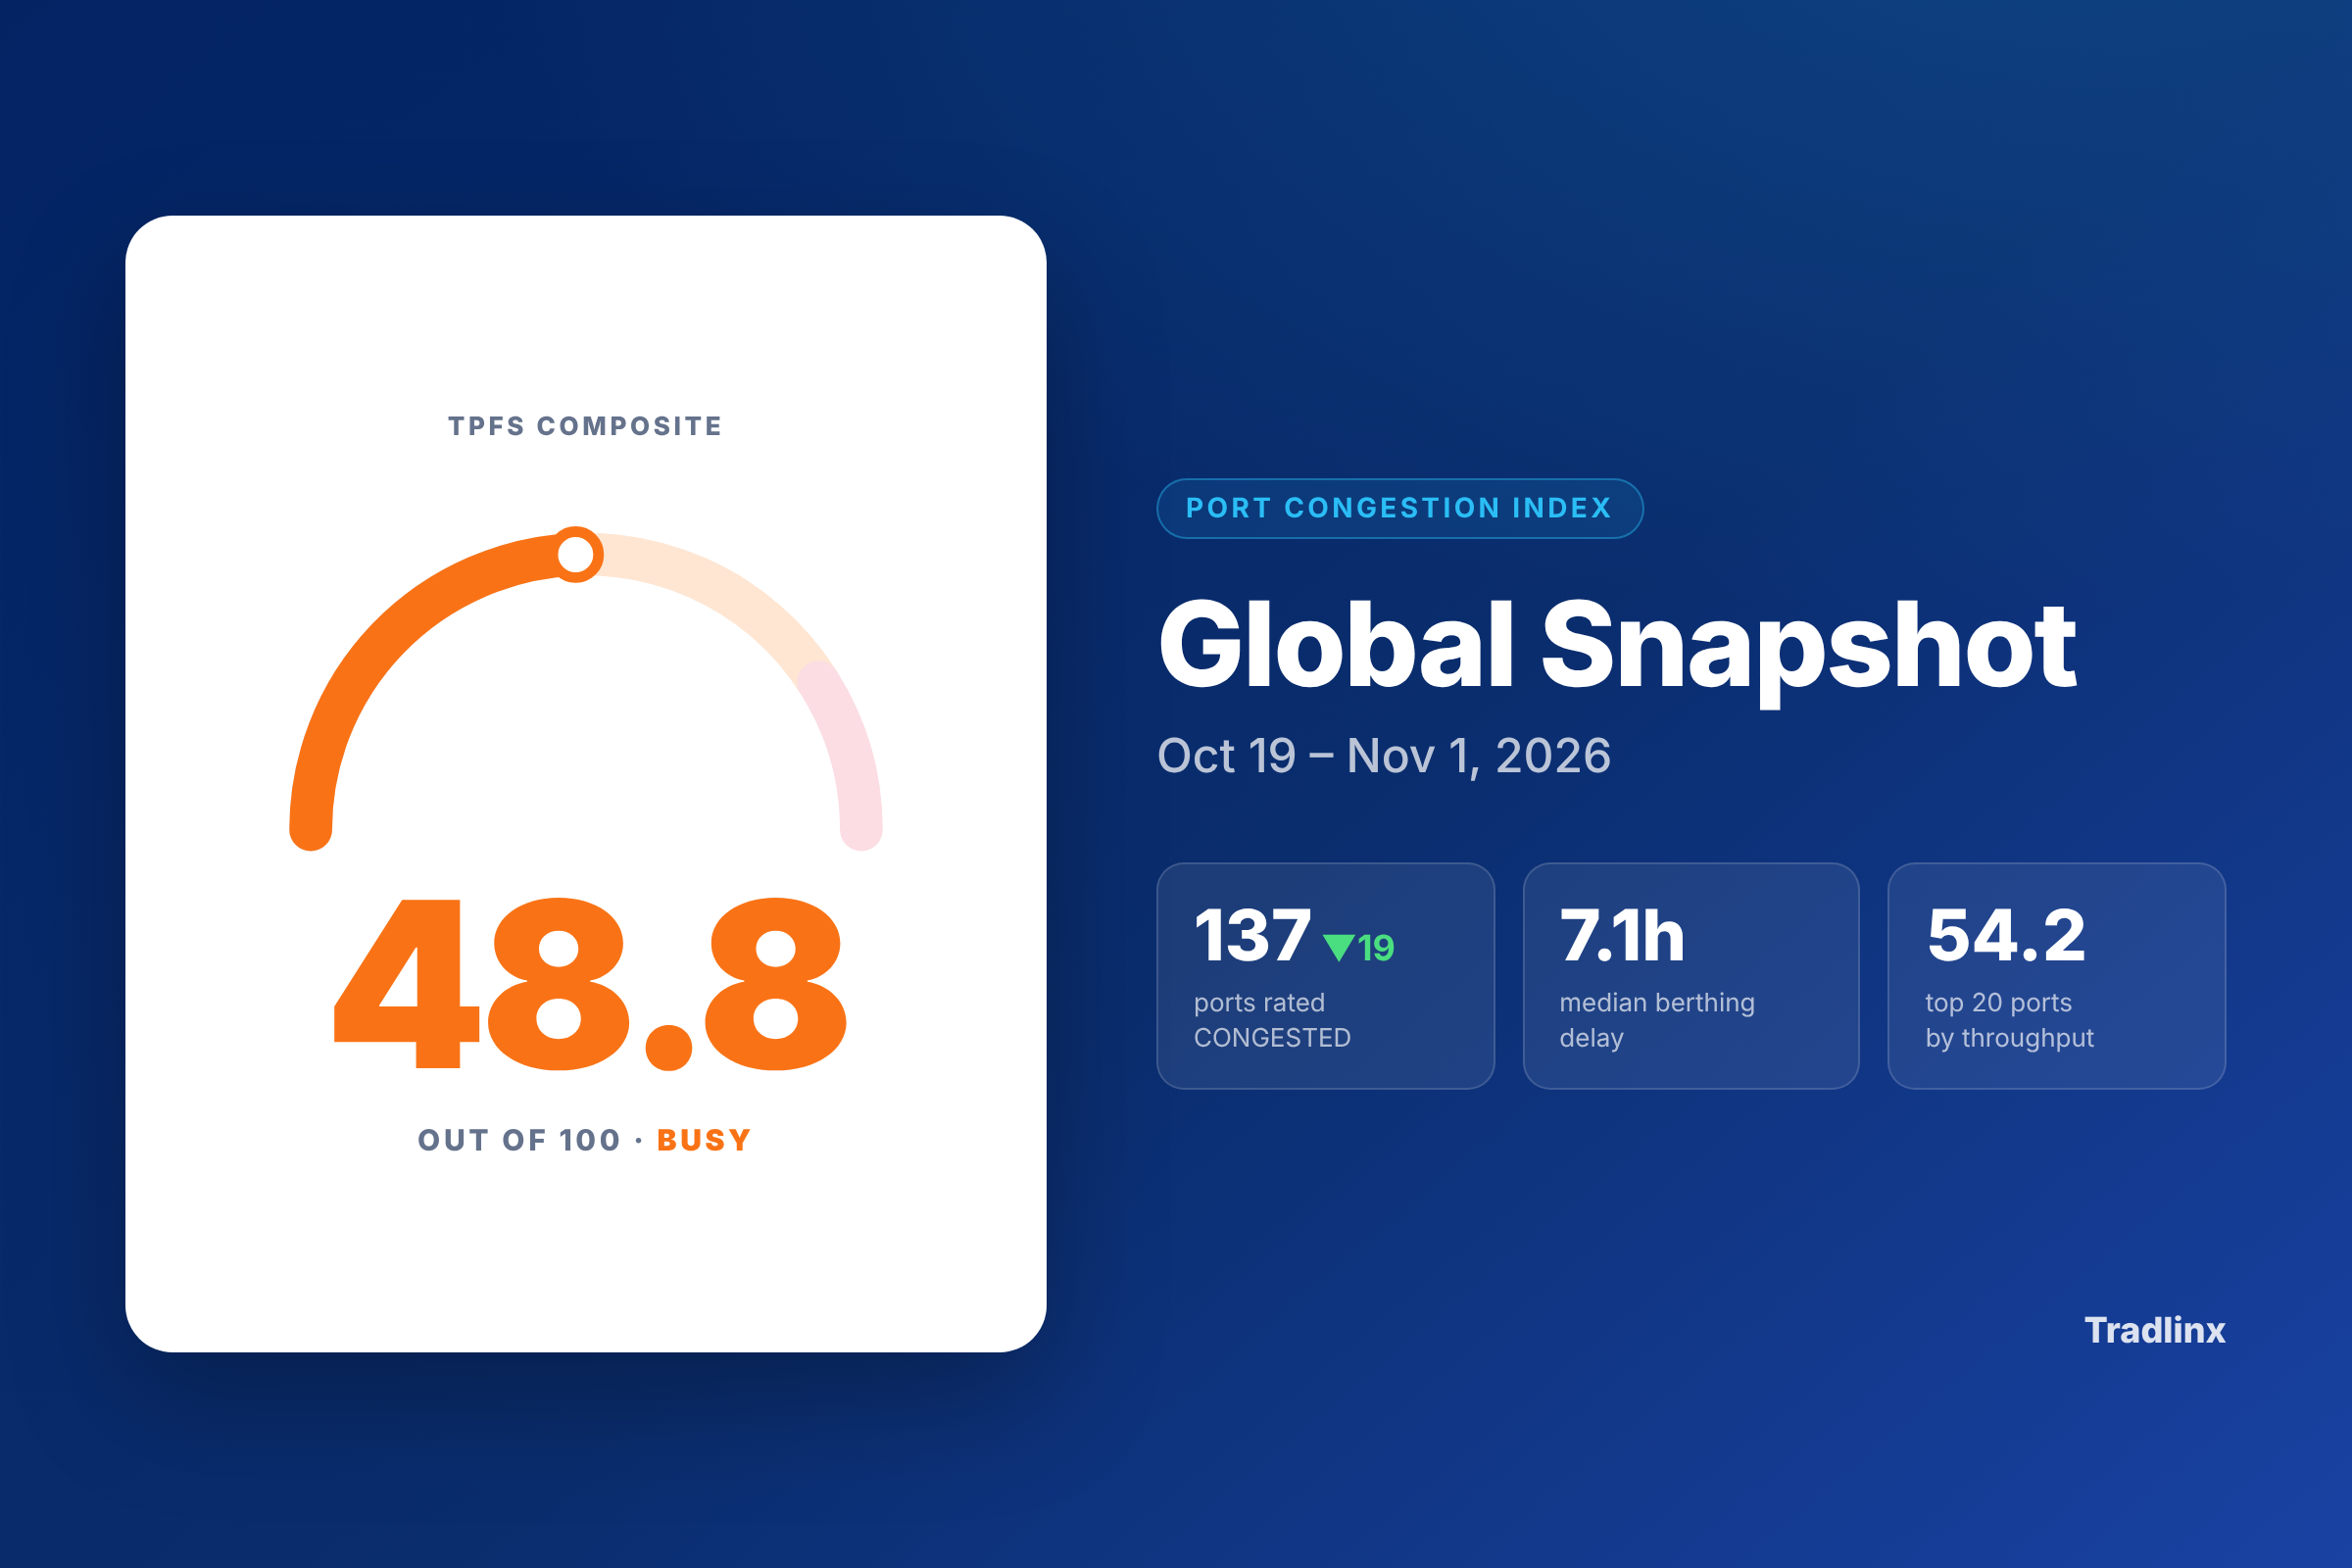
Nineteen fewer ports are rated CONGESTED this cycle, yet the median berthing delay fell just 0.3 hours, and Singapore, Port Klang and Rotterdam each lost the rating with delays down 2.2 hours or less. If you set buffers from a port’s level, check the hours too: this edition, covering Oct 19 – Nov 1, 2026, shows where ratings and delays came apart and where Jebel Ali and Dalian are climbing.

The Global Picture
The Tradlinx Port Flow Score (TPFS) composite reads 48.8 out of 100, in the BUSY band and down from 49.5 in the previous edition. The top 20 ports by throughput score 54.2, down from 54.6 and 5.4 points above the all-port index.
Of 700 active ports in the index, 137 (19.6%) are rated CONGESTED, down 19, while BUSY rose by 12 to 139. The combined elevated group shrank by 7 ports to 276. Median berthing delay slipped from 7.4 to 7.1 hours.
The top-20 score leans on one port this cycle. Guangzhou holds about 6% of top-20 throughput and jumped from LOW to CONGESTED, which we estimate adds at least four points to that score. Its 105.8-hour two-week average sits beside a 3.5-hour reading for the last week and 0.0 for the last three days. Read it as a spike that has already passed unless later readings show otherwise.
Queues remain concentrated. Northeast Asia held 44% of all waiting vessels on the reference date, up from 40%, and Shenzhen’s four terminals showed 308 waiting, up from 275.
The extreme outlier is South Manila, with a 145.6-hour two-week average berthing delay (about 6.1 days), the longest among the 89 key ports and up from 111.5 hours. Its last three days eased to 116.7 hours.
Regional Breakdown
West Africa edged past Southeast Asia for the highest regional score, while the longest median delay sits in East Africa & Indian Ocean.

West Africa scores 59.6, the highest of the 11 regions, with a 25.9-hour median, down from 34.9. Of its 26 ports, 18 (69%) are BUSY or CONGESTED, including 12 CONGESTED.
Southeast Asia fell to 59.1 from 72.4. Its elevated share dropped from 66% to 50% (33 of 66 ports), while the 9.2-hour median did not move. Singapore, Port Klang and Tanjung Pelepas were all CONGESTED two weeks ago and are all BUSY now.
East Africa & Indian Ocean scores 54.4, down from 62.8. It has the longest regional median at 26.1 hours and the highest elevated share at 70% (14 of 20 ports, 8 of them CONGESTED).
Mediterranean reads 55.2 with an 8.2-hour median, down from 10.0, across 107 ports, 46% of them elevated. Koper (31.6 hours) and Trieste (29.8 hours) remain CONGESTED.
South Asia & Middle East scores 54.9 with a 10.5-hour median, and 21 of its 56 ports (38%) are elevated, 13 of them CONGESTED. Jebel Ali’s climb is covered below.
Northeast Asia rose to 53.2 from 45.9, with the median unchanged at 5.0 hours. It has 43 CONGESTED ports, more than any other region, though down from 47. Guangzhou and Dalian both moved into CONGESTED this cycle.
Northern Europe dropped from STABLE to LOW at 25.0, down from 38.9, even as its elevated share rose from 12% to 15%. Rotterdam moved from CONGESTED to BUSY at 10.2 hours, with 15 vessels waiting.
North America has the lowest regional score at 15.7, down from 24.5, and a 4.0-hour median.

Top Congested Ports

This table ranks ports by composite score, so a port’s position and its delay can differ widely.
Manila has three codes in the top 10. South Manila leads at 93.0, and its wait to berth runs 3.5 times the 41.2-hour cargo-handling time. North Manila ranks fifth at 28.7 hours with 16 vessels waiting, and Manila (PHMNL) ninth at 55.5 hours. All three eased over the last three days, to 116.7, 8.2 and 34.3 hours.
Suzhou (Taicang) ranks second at 92.7 with a 12.7-hour delay, and 19 vessels were waiting against 1 at berth on the reference date. Its last week and last three days both ran near 8 hours.
Guangzhou ranks third at 92.1 with 6 vessels waiting. It also tops the report’s bottleneck list, at 9.8 times its 10.8-hour handling time, and that ratio rests on the same 105.8-hour average described above.
Dalian ranks fourth at 91.1 after moving from STABLE to CONGESTED, up 15.4 hours. Its delay has risen in every window: 14.4 hours over one month, 22.3 over two weeks, 25.1 over one week and 41.3 over three days. That three-day reading sits 19.0 hours above the two-week average, the widest gap above average among the key ports.
Vado Ligure and Dongguan tie at 88.5 with opposite short-term readings. Vado Ligure’s three-day figure doubled to 34.0 hours against a 16.3-hour average, while Dongguan’s fell to 3.1 hours against 8.5, with 26 vessels waiting on the reference date.
Chattogram closes the top 10 after moving from BUSY to CONGESTED, up 19.2 hours. Its 40.5-hour delay is the fourth-longest among the key ports.
Where Congestion Is Building
Jebel Ali moved from STABLE to BUSY, up 18.6 hours (188%) to 28.5. That is the longest delay of any BUSY key port and the second-longest among the 10 highest-throughput ports, behind Guangzhou. Its last three days ran higher still at 32.3 hours.
Gioia Tauro (+9.0 hours) and Southampton (+7.1) moved from STABLE to BUSY, both at 18.1 hours. Their latest readings split, with Gioia Tauro at 21.9 hours over three days and Southampton at 5.8. Subic Bay moved from BUSY to CONGESTED, up 7.2 hours to 25.4, though its last three days dropped to 4.1.
The early-warning list flags ports still rated LOW or STABLE with the fastest-rising delays. Gavle leads at +132% from a low base, 2.8 to 6.5 hours. Fuzhou went from 6.6 to 13.4 hours (+103%) and Davao from 8.0 to 13.8 (+73%). Kaohsiung rose 30% to 8.3 hours, and its three-day reading is 14.3.
Where Congestion Is Easing
Constanta posted the largest reduction among ports that changed level, down 24.7 hours and from CONGESTED to BUSY. Koper fell further, from 59.7 to 31.6 hours, but stays CONGESTED. Cai Mep International Terminal dropped 11.0 hours to 4.0 and moved from CONGESTED to BUSY, with 28 vessels waiting on the reference date.
Genoa (−6.6 hours), Mundra (−4.9) and Vancouver (−4.7) all moved from BUSY to STABLE.
The largest hubs lost their ratings on much smaller moves. Singapore (−2.2 hours), Port Klang (−0.3), Rotterdam (−1.1) and Hong Kong (−3.5) all moved from CONGESTED to BUSY. Port Klang still averages 23.4 hours. Rotterdam’s queue was 15 vessels on both reference dates, and Hong Kong’s grew from 53 to 72.
Several ports reversed the level change they made two weeks ago. Port Klang, Hong Kong and Cai Mep International Terminal went from BUSY to CONGESTED and back, Mundra from STABLE to BUSY and back, and Jebel Ali and Gioia Tauro from BUSY to STABLE and back. A port sitting near a threshold can change level with little change in the wait. Plan against the hours.
Did Last Edition’s Three-Day Readings Hold?
The last edition pointed to three-day readings as a guide for near-term arrivals. Here is where the ten ports it called out landed over the following two weeks, in hours.
| Port | Two-week average, Oct 5 – 18 | Three-day reading to Oct 18 | Two-week average, Oct 19 – Nov 1 | Landed closer to |
|---|---|---|---|---|
| South Manila | 111.5 | 155.8 | 145.6 | Three-day |
| Koper | 59.7 | 26.1 | 31.6 | Three-day |
| Cai Mep International Terminal | 15.0 | 38.0 | 4.0 | Two-week |
| Dongguan | 8.6 | 30.1 | 8.5 | Two-week |
| Port Klang | 23.8 | 32.9 | 23.4 | Two-week |
| Ashdod | 25.9 | 53.9 | 19.5 | Two-week |
| Piraeus | 18.6 | 31.7 | 17.9 | Two-week |
| Vancouver | 18.8 | 3.5 | 14.1 | Two-week |
| Trieste | 24.9 | 2.3 | 29.8 | Two-week |
| Tanjung Priok | 20.8 | 2.0 | 24.0 | Two-week |
Eight of the ten landed closer to their earlier two-week average. These ports were named because their readings looked extreme, so some snap-back is expected, and ten ports are a small sample. Even so, the short window worked better as an alarm than as a forecast: a three-day spike is a reason to re-check the port in a few days before moving a plan or a customer ETA.
Short windows are pulling away from the averages again this cycle. Among ports with a two-week delay of at least 6 hours and a non-zero three-day reading, 181 ran more than 10% below their average over the last three days and 98 ran more than 10% above it. Dalian (41.3 against 22.3), Benghazi (39.3 against 22.5) and Vancouver (25.7 against 14.1) are the ones to re-check on the way up. Trieste (4.8 against 29.8) and North Manila (8.2 against 28.7) are the ones to re-check before assuming the queue has cleared.
If your team re-checks berth delays at these gateways by hand between editions, see how ops teams monitor port congestion on a rolling basis.
Explore the Full Report
The full report includes an interactive global map with port search, the top 10 ports by throughput with berthing delay trends, longest pre-berth waiting times, severe bottleneck analysis and the early-warning list.
View the full Port Congestion Index report →
The PCI report is published biweekly, drawing on Port Congestion API coverage of 1,253 ports worldwide. This edition includes 700 active ports in the global index, with detailed port-level analysis across 89 key ports. Levels, scores and delays are two-week averages; waiting and at-berth vessel counts are for the reference date. The Tradlinx Port Congestion Index is derived from Port Congestion API data and is informed by UNCTAD port-performance indicators, queueing theory (Lq/L), and Tradlinx proprietary thresholds. Data as of November 1, 2026.
Need help interpreting this disruption or your shipment?
For a quick question, chat with Tradlinx on WhatsApp. For a deeper discussion, book a time below.



Leave a Reply