

Spot rates on the main east–west lanes climbed again this week, with sharp increases across both the Transpacific and Asia–Europe trades. The Drewry World Container Index rose 9% to $4,530 per 40-foot container in the week to July 2 — up 61% year over year and at its highest level since September 2024 — with carriers pursuing another round of July increases behind it.
This Week’s Rates
| Route | Rate ($/40ft) | WoW Change |
|---|---|---|
| Shanghai → Los Angeles | $6,349 | +10% |
| Shanghai → New York | $7,902 | +11% |
| Shanghai → Rotterdam | $4,682 | +7% |
| Shanghai → Genoa | $6,360 | +10% |
| WCI Composite | $4,530 | +9% |
Freightos Baltic Index lanes show the same direction through a different dataset. Asia–US West Coast and East Coast rates each rose 8% in the week to June 27, putting West Coast rates near $6,200 per FEU and East Coast rates around $8,000 per FEU. West Coast rates had climbed approximately 120% since mid-May, while East Coast rates were up 85% over six weeks.
For context, Freightos reported that East Coast rates were about $1,000 per FEU above the frontloading-driven summer high recorded in 2025, while West Coast rates were just above their 2025 peak. Asia–North Europe and Asia–Mediterranean rates were approximately $1,300 and $3,000 above their respective 2025 peak-season highs.
What’s Driving the Increase
Near-term Transpacific space remains tight. Drewry’s Container Capacity Insight counted eight blank sailings on the Transpacific for the following week and one on Asia–Europe. Across the wider five-week outlook, however, Drewry says carriers are restoring capacity and blank sailings are easing. Strong demand and congestion are still outweighing that improvement for now.
July increases are being tested. Carriers continue announcing higher FAK rates, general rate increases, and peak season surcharges across major east–west trades. Drewry expects spot rates to keep rising in the coming weeks, but the degree to which the latest increases hold will show how much pricing power carriers retain as July progresses.
Congestion is reducing effective capacity. Freightos reports that surging volumes at major hubs in South Asia, the Far East, and Europe are causing delays that keep ships and containers tied up for longer. That reduces the capacity available on schedule even as carriers begin restoring nominal capacity.
Demand was pulled forward. Frontloading ahead of July BAF increases, manufacturer price hikes, and the approaching US tariff deadline pushed peak-season volume into May and June. Middle East disruption remains a background operational risk, but Freightos identifies surging peak-season demand — rather than oil prices — as the main driver of current container-rate increases.

What This Means for Shippers
Shipping Transpacific: double-digit weekly rate gains and eight announced blank sailings mean both price and space risk remain active. Revalidate quotes that predate the latest July increases, and confirm whether a booking reference is backed by protected space, available equipment, or a committed allocation.
Shipping Asia–Europe: Drewry recorded weekly increases of 7% to Rotterdam and 10% to Genoa. Freightos’ broader regional indexes rose more moderately — 3% to North Europe and 2% to the Mediterranean — but remained well above their 2025 peak-season highs. The indexes use different lane definitions and methodologies, so their rates and weekly changes should not be compared directly.
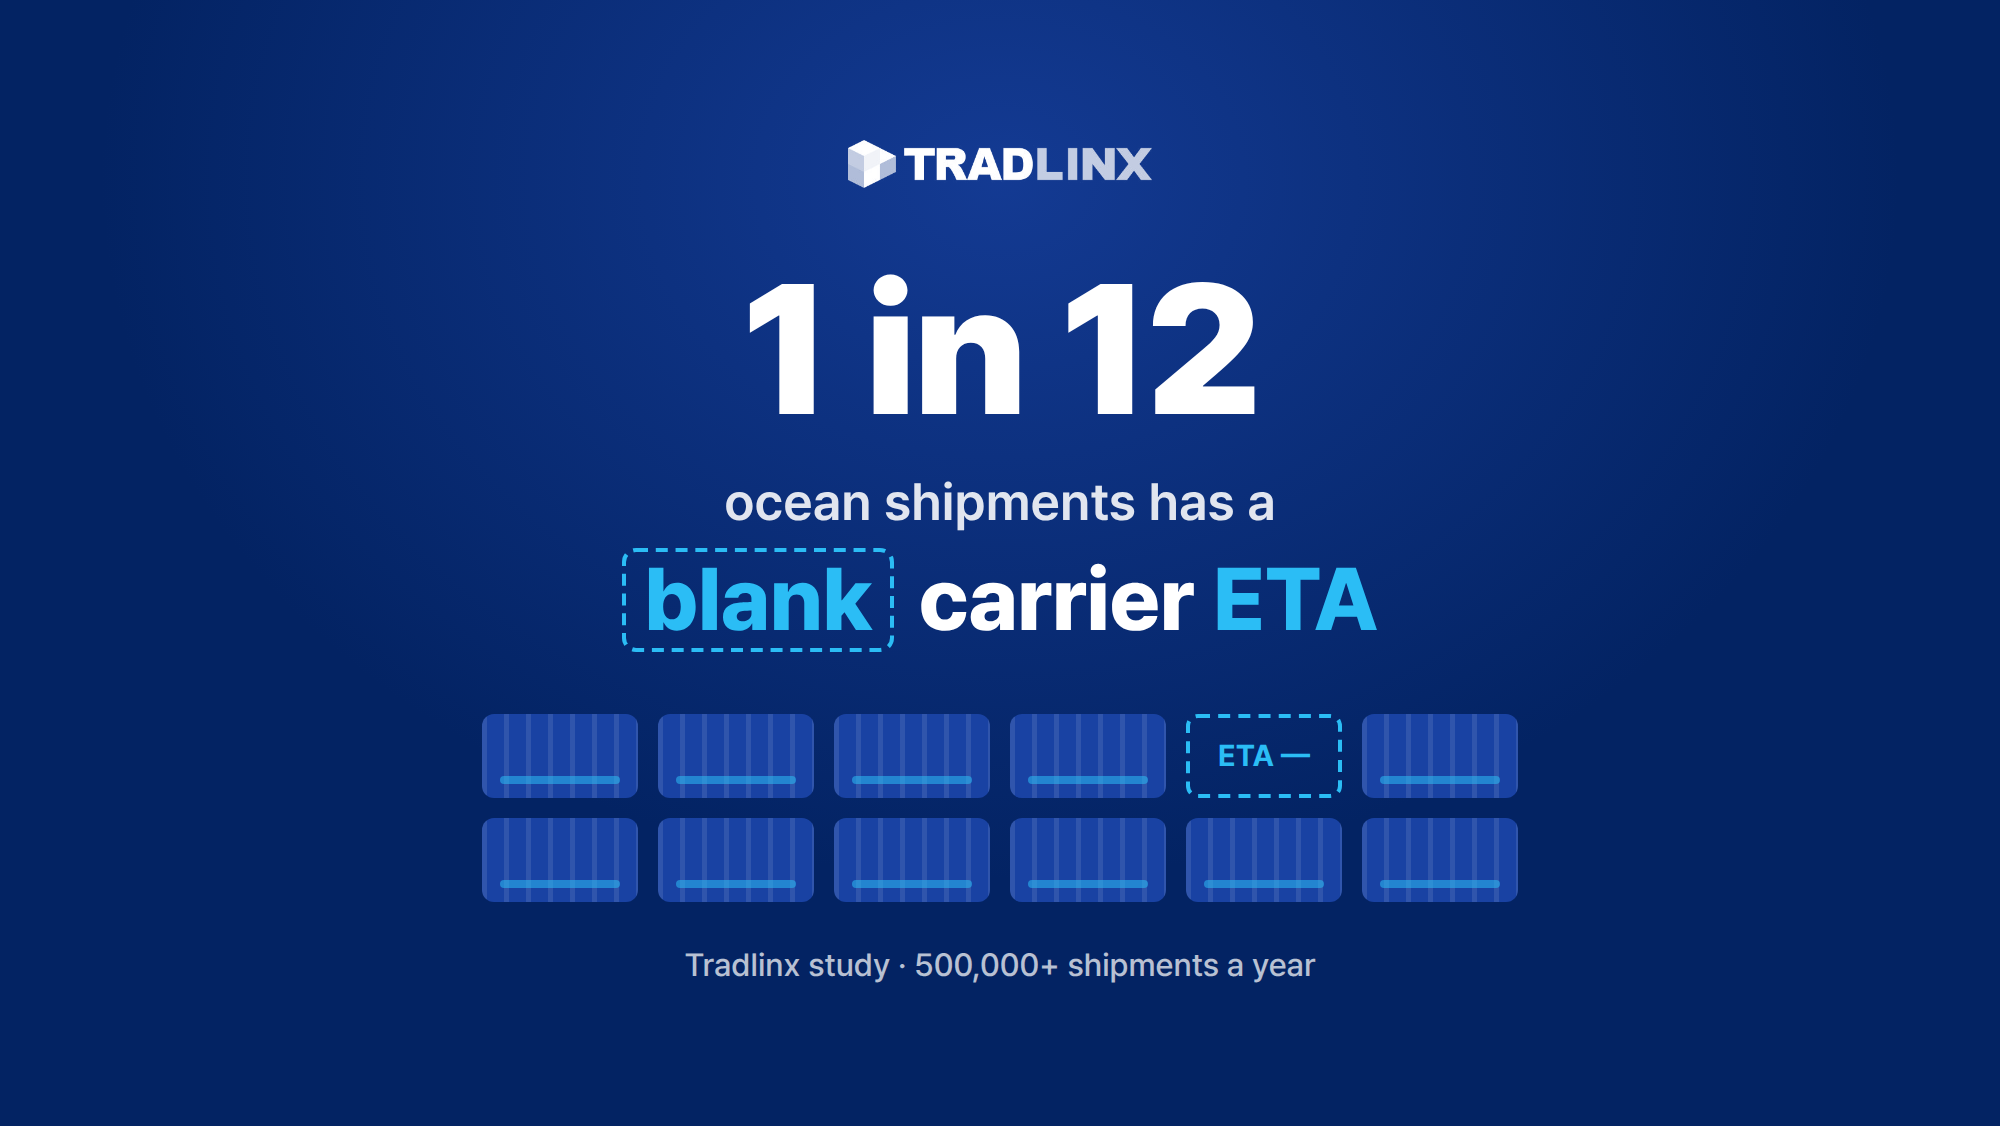
A blank sailing can lead to rolled or rebooked cargo, revised ETAs, missed connections, and downstream free-time exposure that appears later as detention and demurrage risk. If your team is finding out about blanks and rollings from individual carrier portals after the fact, see how Tradlinx helps teams monitor shipment across carriers in one view.
The Signal to Watch
The forward question is how long the current pricing level can hold. Freightos notes that because so much peak-season volume was pulled into May and June, the early start could also produce an earlier unwind, possibly sometime in July.
The degree to which July increases hold will help show whether demand and congestion remain strong enough to support the new pricing level. Rapid erosion would be an early sign of weakening carrier leverage, though it would not by itself confirm that peak season is over.
Congestion could also keep the market tight for longer than underlying booking demand would suggest. Watch vessel queues and schedule reliability at major Asian and European hubs alongside the rate indexes. A softer rate print will mean less if delayed rotations are still reducing the capacity that actually arrives on schedule.
Further Reading
- Drewry World Container Index — July 2, 2026
- Drewry Cancelled Sailings Tracker — July 3, 2026
- Freightos Weekly Update — June 30, 2026
Rate figures are spot-market assessments from the Drewry World Container Index and Freightos Baltic Index. The indexes use different lane definitions and methodologies and are not directly comparable. Neither should be treated as a complete shipment-cost estimate; carrier quotations may also include surcharges, origin and destination charges, inland transportation, and other accessorial costs. Surcharge amounts, effective dates, and applicability depend on the relevant carrier notice, tariff, trade scope, and contract terms.
Need help interpreting this disruption or your shipment?
For a quick question, chat with Tradlinx on WhatsApp. For a deeper discussion, book a time below.
Prefer email? Contact us directly at min.so@tradlinx.com (Americas), sondre.lyndon@tradlinx.com (Europe), or henry.jo@tradlinx.com (EMEA/Asia).


Leave a Reply