

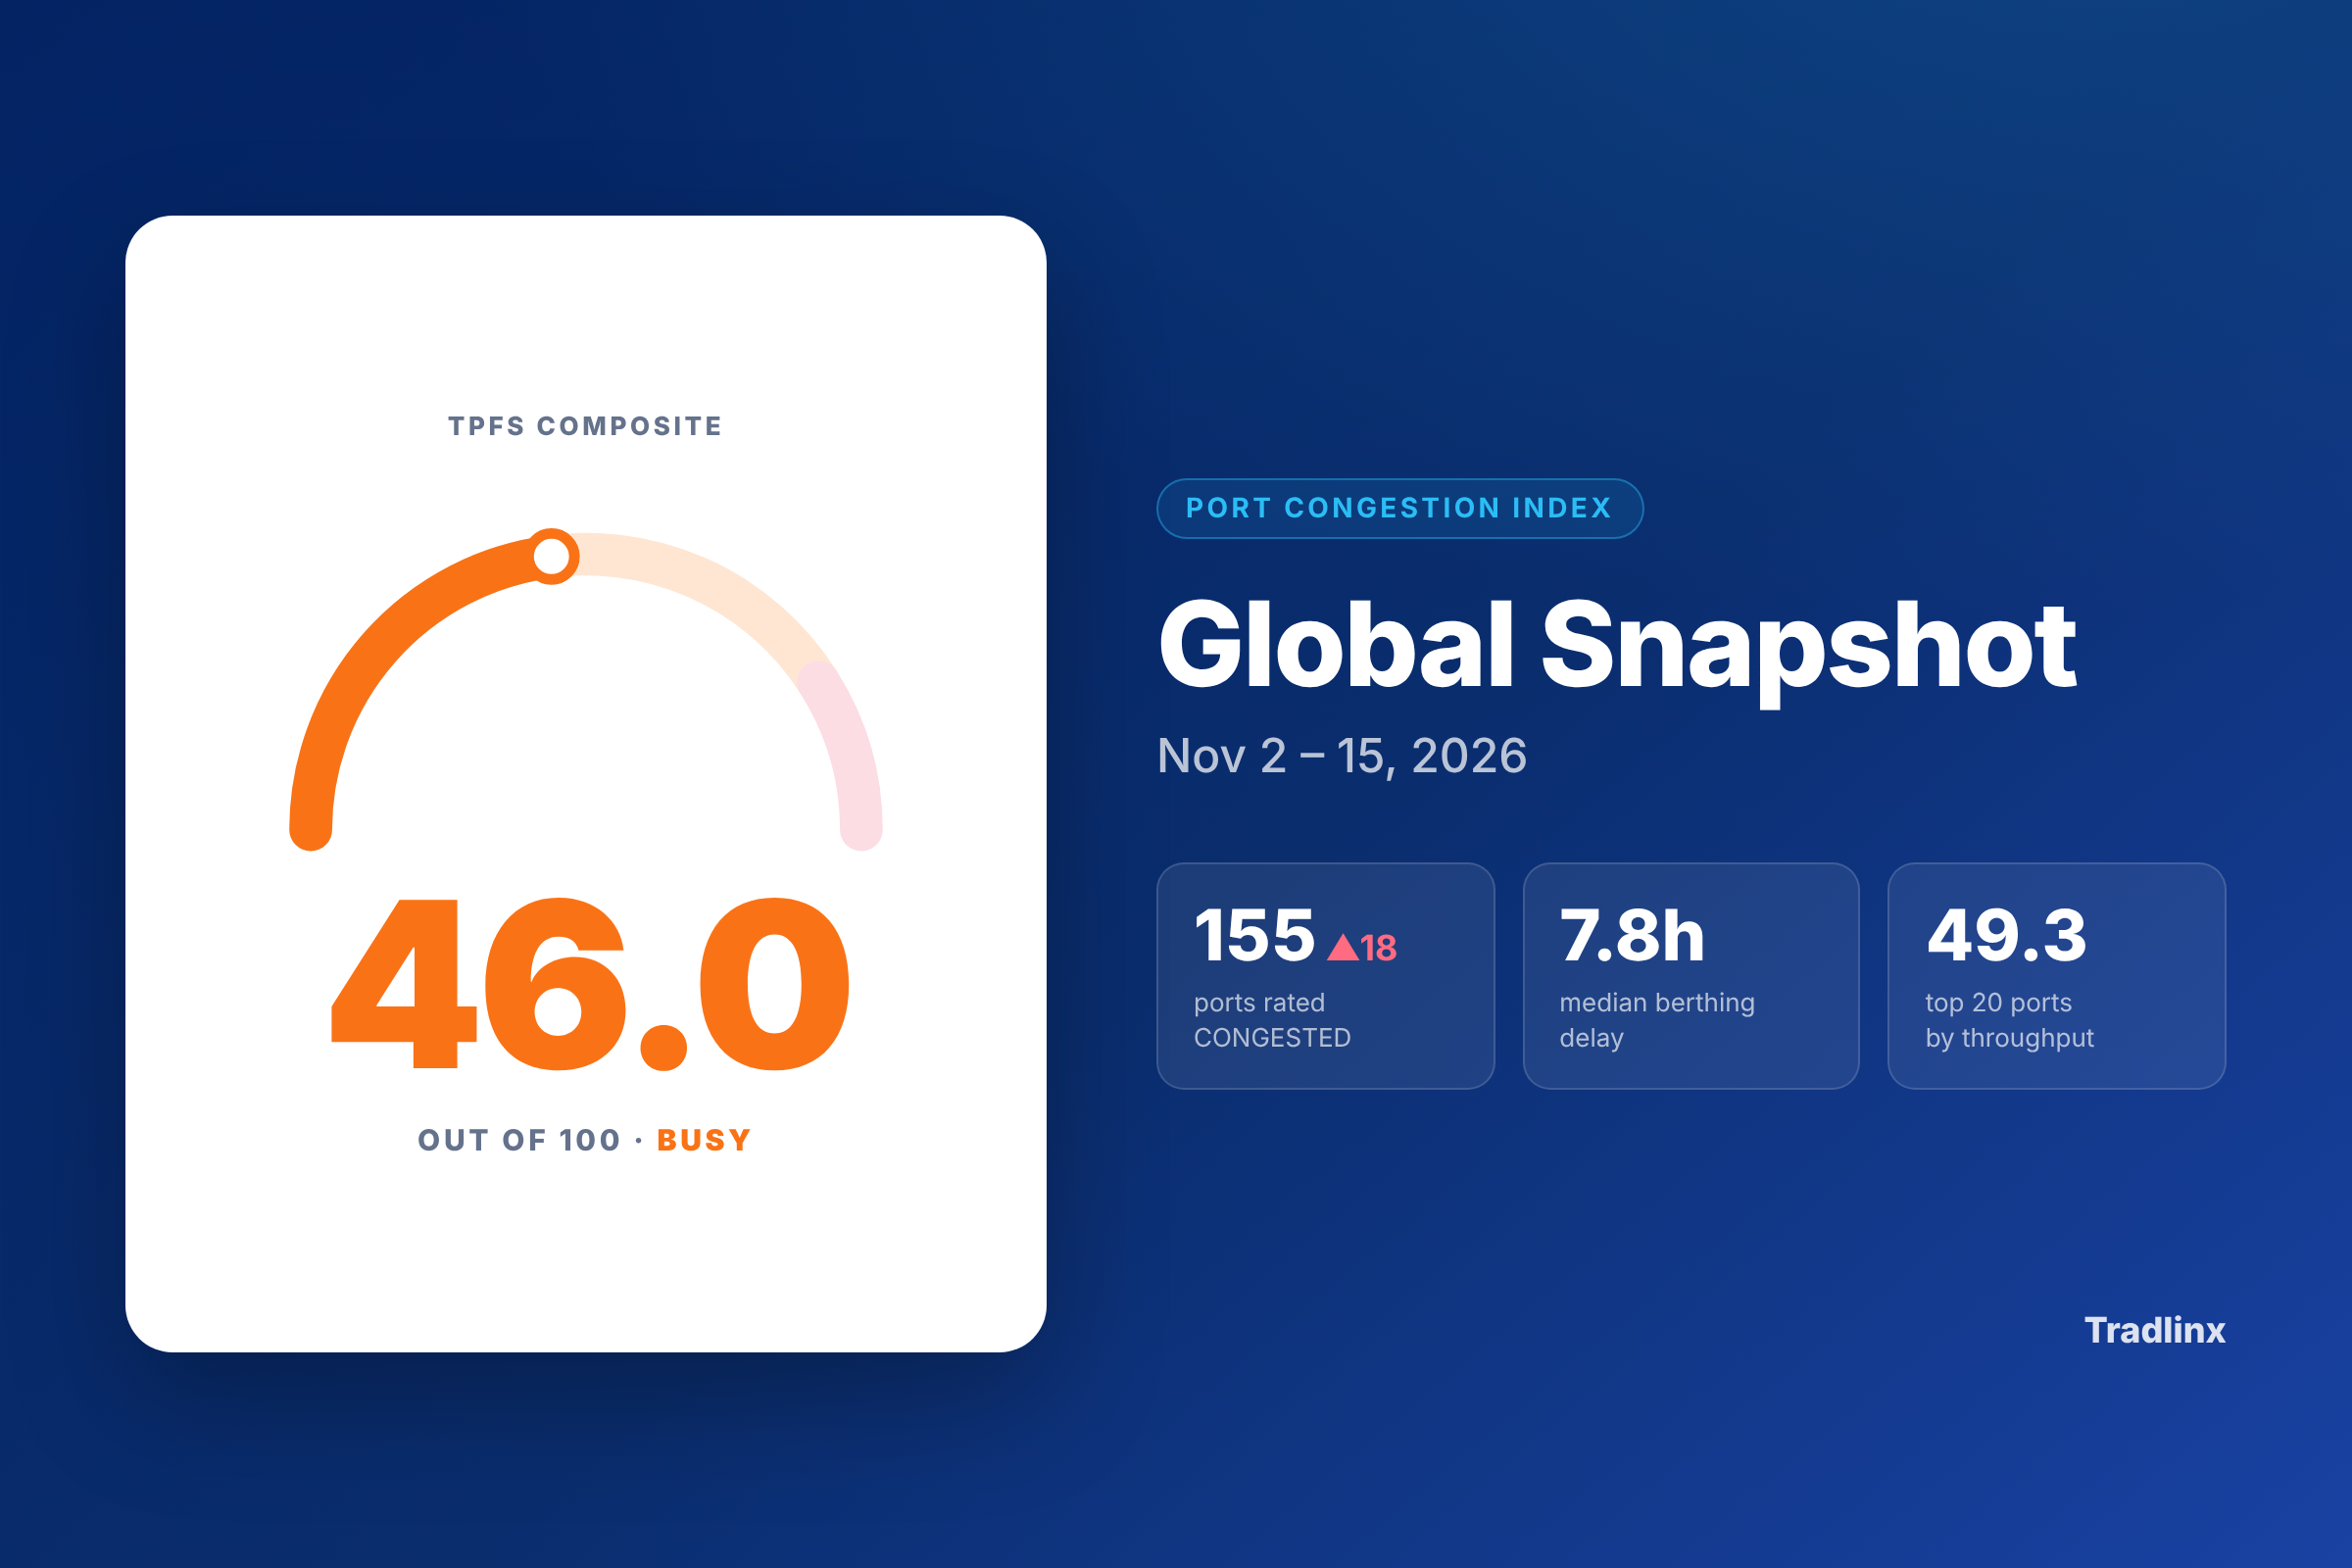
Felixstowe’s average berthing delay reached 49.0 hours in the two weeks to November 15, up 36.0 hours on the previous two weeks, according to the Tradlinx Port Congestion Index. Shenzhen rose 4.2 hours over the same period. Jebel Ali moved the other way, falling 15.5 hours.
Changes like these don’t automatically reach the planned lead times in an ERP. Many planning systems use a fixed lead time for a lane or supplier, and if that number was set from carrier schedules months ago, it may no longer reflect current conditions. An underestimated lead time can contribute to stockouts and expedited freight. An unnecessarily long one can bring orders forward and tie up money in excess inventory.
Port averages alone cannot tell you how much to change a planned lead time. Your own container milestones show what each lane actually takes. Below is what the latest port data shows, and how to use it alongside shipment records to recalibrate planning assumptions.
What Two Weeks of Port Data Show
| Port | Oct 19 to Nov 1 | Nov 2 to 15 | Change | Level now |
|---|---|---|---|---|
| Felixstowe | 13.0h | 49.0h | +36.0h | CONGESTED (was STABLE) |
| Vancouver | 14.1h | 21.2h | +7.1h | BUSY (was STABLE) |
| Nhava Sheva | 13.3h | 19.1h | +5.8h | BUSY (was STABLE) |
| Shenzhen | 8.5h | 12.7h | +4.2h | CONGESTED |
| Port Klang | 23.4h | 23.4h | 0.0h | CONGESTED (was BUSY) |
| Jebel Ali | 28.5h | 13.0h | -15.5h | STABLE (was BUSY) |
The moves run in both directions, and several are large against lead times usually planned in whole days. Port Klang shows a different pattern: its two-week average delay held at 23.4 hours while its composite congestion level worsened. The classification reflects more than berthing delay alone, so a flat delay figure does not necessarily mean conditions are unchanged.
Two Directions, Different Planning Risks
A planned ocean lead time may account for several stages: time at the origin terminal, waiting to berth, the sea passage, any transshipment, waiting to berth at destination, and discharge to pickup. Carrier schedules provide planned transit times, but actual elapsed time can change when vessels queue, connections are missed or containers remain at terminals.
Shenzhen to Felixstowe. In the two weeks to November 1, average berthing waits at the two ports added up to 21.5 hours. In the two weeks to November 15, they added up to 61.7 hours, an increase of 40.2 hours, or about 1.7 days. That is a useful warning signal for planners monitoring this route, but it is not a measured 1.7-day increase in shipment transit time. The figures are separate port-wide averages, and the actual impact depends on the vessels, terminals and services used. Shenzhen’s aggregate also covers multiple terminal areas. Check the relevant calls and container milestones before changing the lane’s planned lead time.
Lanes into Jebel Ali. The average berthing delay fell from 28.5 to 13.0 hours. If planners added extra lead-time allowances during the earlier congestion, this improvement is a reason to review them. Keeping unnecessary padding can bring orders forward and increase inventory, but the allowance should only be reduced when shipment-level performance confirms that the improvement is holding.
Port waits also interact with wider schedule disruption. Sea-Intelligence put global schedule reliability at 50.6% in September 2026, with vessels classified as late arriving an average of 6.65 days behind schedule. Those are global vessel-level figures, not delays to apply directly to an individual shipment or lane.
Berthing Delay Is One Part of the Gap
The Port Congestion Index reports average waiting time before berthing for vessels at a port. Your containers can fare better or worse than that average. On a weekly service, a rolled container can add roughly a week or longer, depending on the next available sailing, as covered in how to tell a rollover from a vessel delay. Transshipment dwell and terminal time after discharge can add further delays.
To measure the actual port-to-port movement of your containers, compare consistent milestones, such as gate-in at origin to gate-out at destination. That interval captures more than the published sailing time, including time spent waiting at terminals, but it does not include inland transport before origin gate-in or after destination gate-out. If your ERP plans from purchase order to warehouse receipt, those additional stages must be included in the comparison.
When the planned lead time remains fixed while actual shipment times change, the difference can accumulate unnoticed until inventory or delivery commitments come under pressure.
If planned lead times in your ERP still rely heavily on carrier schedules, walk through how teams use actual transit times from container milestones to inform their planning systems.

How to Recalibrate Lead Times From Shipment Data
- Pull 6 to 12 months of container milestones per lane and carrier, where sufficient records are available. Measure elapsed time consistently, such as from gate-in at origin to gate-out at destination. Use more recent shipments to check whether older observations still reflect current conditions.
- Compare the median and the spread of actual times with the planned lead time on each lane. Look at the upper end of the distribution as well as the typical shipment. Lead-time variability is one input to safety-stock planning, alongside demand variability and the required service level. Why an average cannot size a buffer covers the importance of variation in more detail.
- Break the actual time into stages to see which one moved: origin dwell, sea passage, transshipment and destination dwell. Where vessel arrival and berthing events are available, examine pre-berth waiting separately. Check milestone coverage before attributing a delay to a particular stage.
- Set a review trigger on berthing delay at the ports on each lane, for example a change of more than 24 hours in the two-week average. Use the trigger to investigate affected shipments, rather than automatically adding or subtracting the same number of hours from the ERP.
- Set a review cadence, such as monthly for volatile lanes and quarterly for stable ones, or establish a process to update lead-time assumptions through an integration with your planning system. Changes should reflect sustained shipment performance and the lead-time definition used in that system.
Checklist Before the Next Planning Cycle
- List the origin and destination ports on each lane and check their latest two-week berthing delay.
- Flag lanes where the combined change in port averages exceeds your review trigger, then check the actual services and terminals involved.
- Compare planned lead time with the actual median and spread from container milestones, using matching start and end points.
- Identify rollovers separately from vessel delays when diagnosing variation, while retaining both in the actual lead-time history.
- Review opportunities to lower lead times where port delays have eased, as well as raising them where actual shipment times have increased. Confirm changes against recent shipment records.
- Record the date each lead time was last updated and the shipment data used to justify the change.
Further Reading
- Tradlinx: Global Port Congestion Index, data as of 15 November 2026
- Tradlinx: Global Port Congestion Index, data as of 1 November 2026
- Sea-Intelligence: Global Schedule Reliability Records a Marginal Gain in September
Sources: Berthing delay figures are two-week averages from the Tradlinx Port Congestion Index, data as of 15 November 2026, comparing 2 to 15 November with 19 October to 1 November. Previous-period values for Felixstowe, Vancouver and Nhava Sheva are derived from the reported changes. The Shenzhen figure is a combined port-area reading. Schedule reliability figures are from Sea-Intelligence’s Global Liner Performance report for September 2026, published 28 October. Port-wide vessel averages are indicators of congestion conditions and do not directly measure the elapsed transit time of individual containers.
Need help interpreting this disruption or your shipment?
For a quick question, chat with Tradlinx on WhatsApp. For a deeper discussion, book a time below.

Leave a Reply