

A European port tops the composite congestion ranking this edition: Zeebrugge, freshly escalated to CONGESTED on a sharp worsening trend. Behind it, the Manila cluster stayed acute and Subic Bay jumped nearly 30 hours into the congested tier. This edition covers the two weeks ending September 7.

The Global Picture
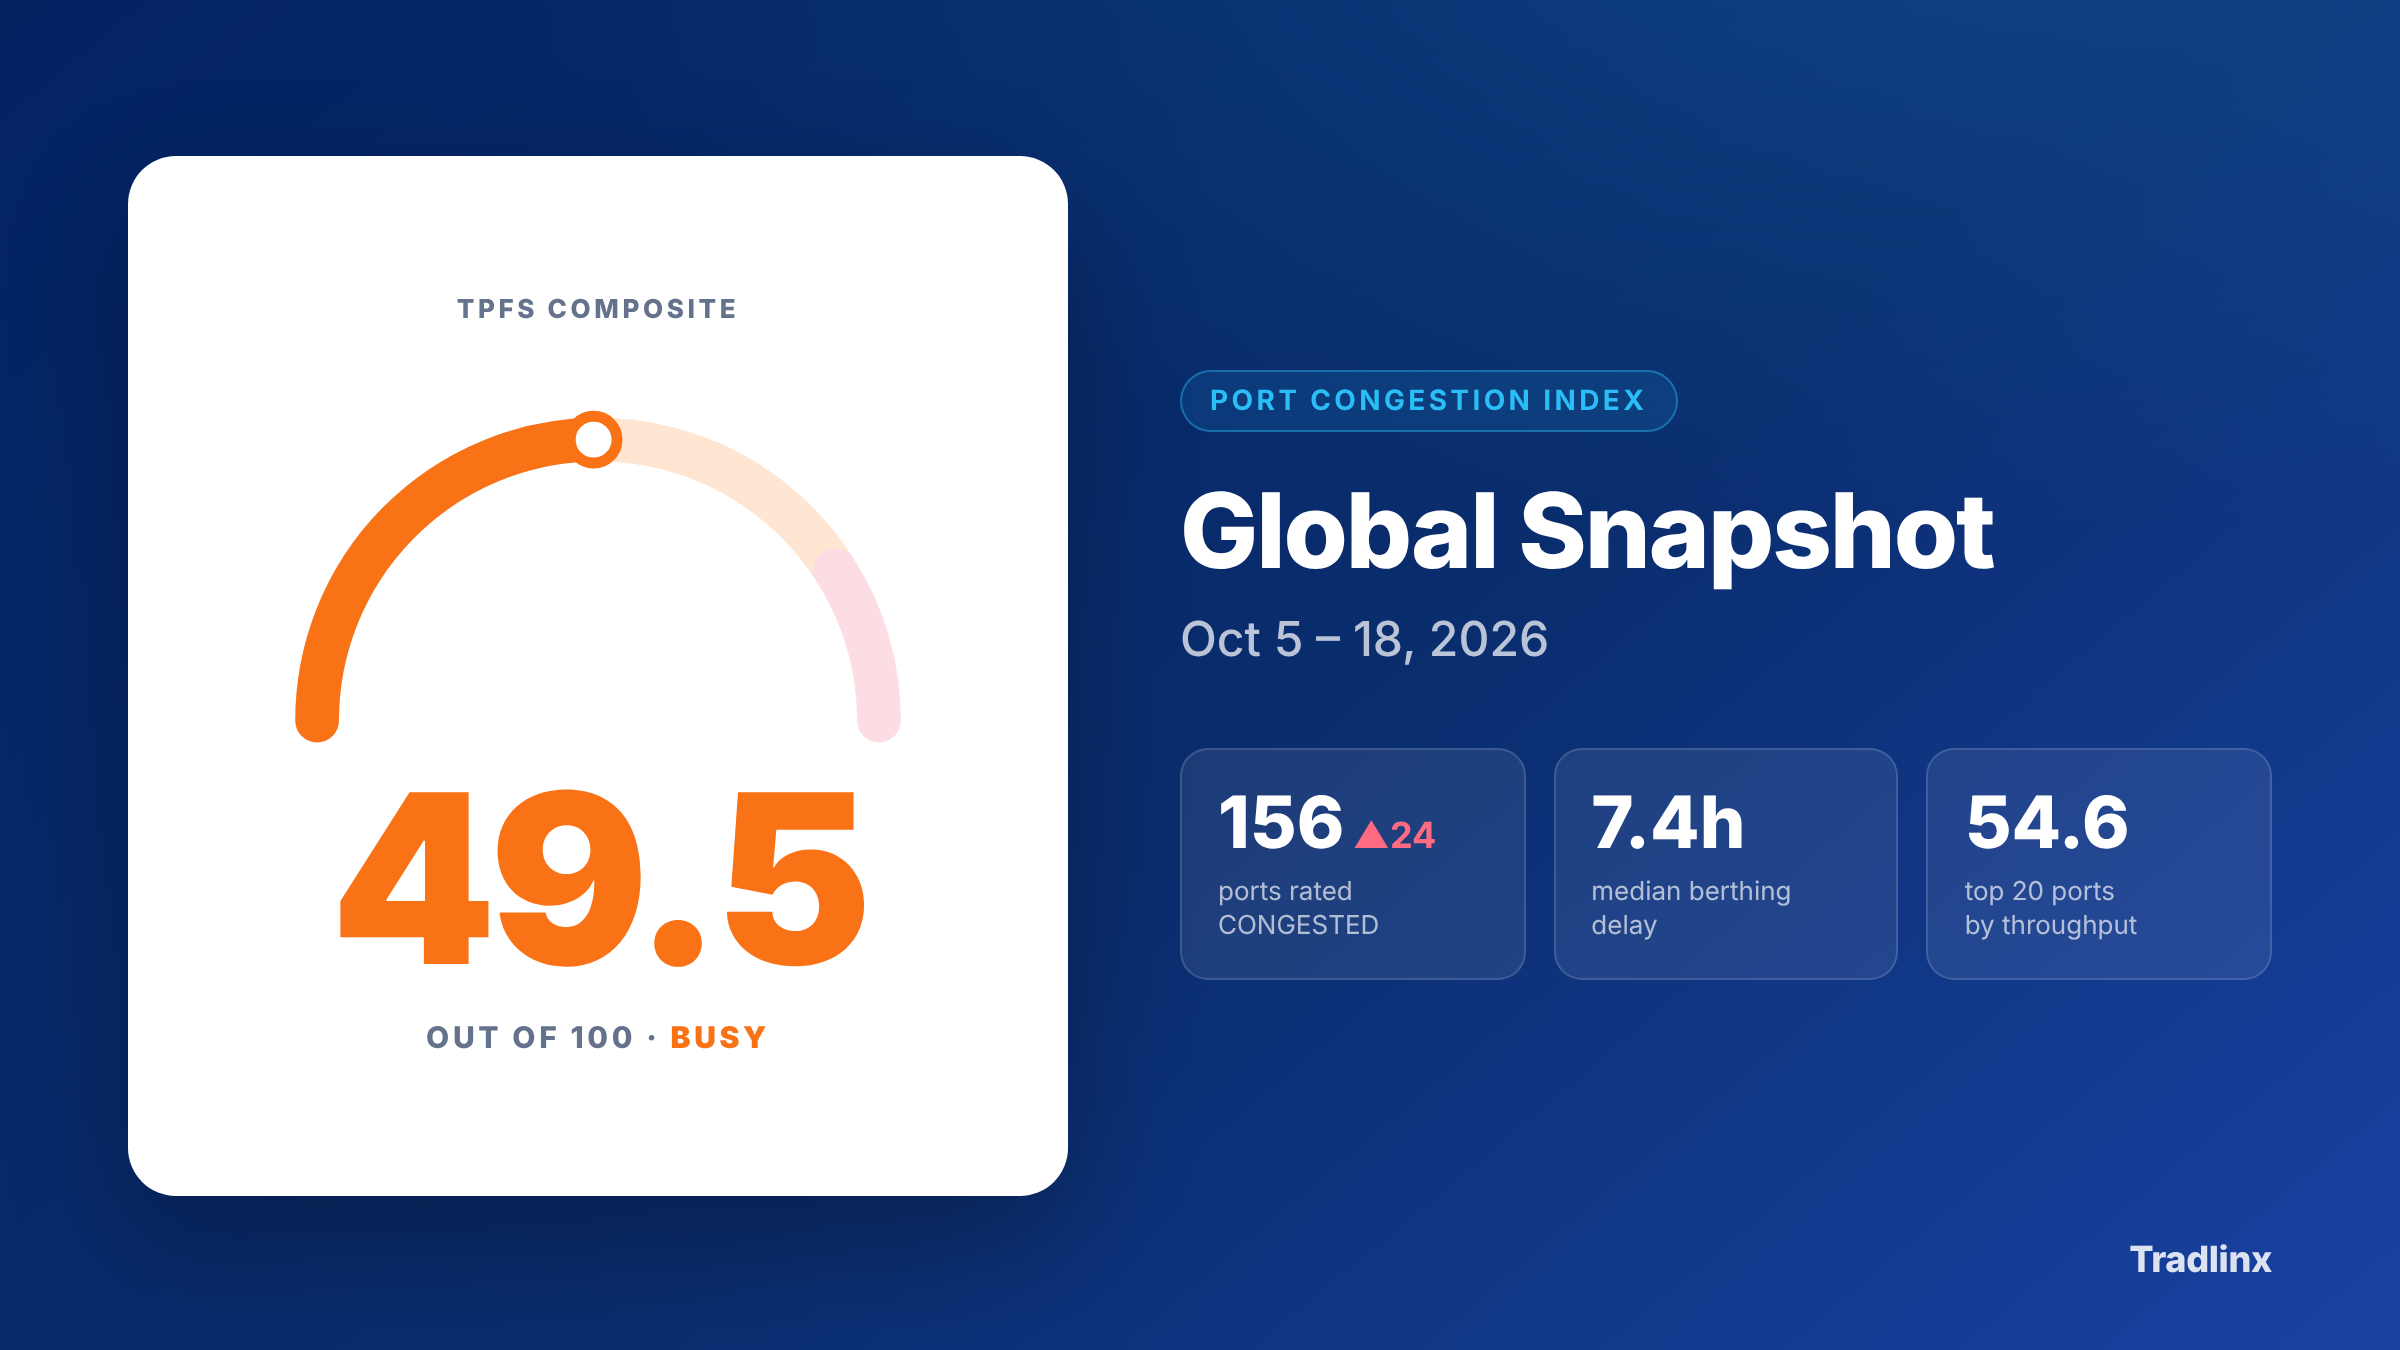
The Tradlinx Port Flow Score (TPFS) composite reads 47.5 out of 100, in the BUSY band. The report characterises this as worse than the previous two weeks, though the move is modest. Median berthing delay is 8.7 hours.
Across the 695 ports with recorded vessel traffic, 141 are CONGESTED (20.3%) and 133 BUSY (19.1%). The notable internal shift is toward the middle of the distribution: STABLE gained 17 ports while both LOW and the elevated bands eased slightly. The congestion picture is broadly steady rather than escalating.
The throughput-weighted view again runs hotter than the all-port index. Across the top 20 ports by container volume, the TEU-weighted TPFS is 52.2, sitting 4.7 points above the all-port figure. Separately, 81% of all waiting vessels are sitting at ports rated CONGESTED, with Northeast Asia accounting for the largest share.
Regional Breakdown: West Africa Deepest and Highest-Scoring
Delay depth and composite score continue to point at different regions.

West Africa carries the deepest delays at 34.7 hours across 26 active ports, 16 of them CONGESTED. East Africa & Indian Ocean follows at 20.4 hours.
West Africa also holds the highest regional composite at 62.6, narrowly ahead of Southeast Asia at 62.4. The Southeast Asian figure reflects the persistent Manila cluster alongside heavy Indonesian and Malaysian activity at a 10.0-hour delay. South Asia & Middle East (56.8) follows.
Mediterranean sits at a 52.6 composite with 27 ports BUSY and 23 CONGESTED across 108 active. Northeast Asia holds the largest absolute count of elevated ports, 37 BUSY and 40 CONGESTED out of 164, though its median delay stays low at 5.5 hours.
North America remains the calmest region, reporting zero CONGESTED ports across 48 active, though several US ports edged up this edition. Northern Europe sits at a 4.4-hour median delay despite Zeebrugge’s escalation.
Top Congested Ports: Zeebrugge Leads, Manila Cluster Persists

Zeebrugge holds the highest composite score at 93.6, newly rising into CONGESTED, though its 18.6-hour delay is moderate. Its position at the top reflects a sharp worsening trend rather than the deepest wait.
The Manila cluster remains the network’s most acute delay. South Manila holds the deepest single wait at 136.4 hours, with North Manila (55.5 hours, rising) and Manila (58.0 hours) also in the top ten, all three CONGESTED.
Within the top-10 composite ranking, Yantian (Shenzhen) carries the largest waiting count at 49 vessels. Subic Bay is the standout escalation at 42.9 hours, and Izmit in Turkey sits at #4 with a rising flag.
Movers: What Worsened and What Eased
Worsening: Subic Bay led with a 29.1-hour increase, jumping from STABLE straight to CONGESTED. Zeebrugge (+12.9h) and Colombo (+4.8h) both moved from BUSY into CONGESTED, and Izmit made the same jump. Several US ports, including Charleston, Miami, and Long Beach, edged from LOW up to STABLE.
Easing: Bingazi posted the largest improvement, shedding 20.9 hours and dropping from CONGESTED to BUSY. Dalian (-9.4h) and Vado Ligure (-9.4h) followed, with Dalian easing all the way to STABLE. Constanta and Gioia Tauro both stepped down a level, and Vancouver improved to LOW.
Several Mediterranean ports eased this edition, with Vado Ligure, Constanta, and Gioia Tauro all improving. New pressure concentrated instead in the Philippines, Turkey, and a cluster of US ports ticking upward.
Explore the Full Interactive Report
This post covers the highlights. The full report includes an interactive global map, detailed port tables, top-hub throughput analysis, waiting-time and slow-operations views, and berthing delay trends.
View the full Port Congestion Index report →
The PCI report is published biweekly, drawing on Port Congestion API coverage of 1,253 ports worldwide. This edition includes 695 active ports in the global index, with detailed port-level analysis across 91 key ports.
The Tradlinx Port Congestion Index is derived from Port Congestion API data and is informed by UNCTAD port-performance indicators, queueing theory (Lq/L), and Tradlinx proprietary thresholds. Distribution shares are calculated across ports with recorded vessel traffic in the period (695 of 1,253 monitored), and the headline delay figure is a median. Data as of September 7, 2026.



Leave a Reply